
Top 9 ASX gold stocks to watch in 2026
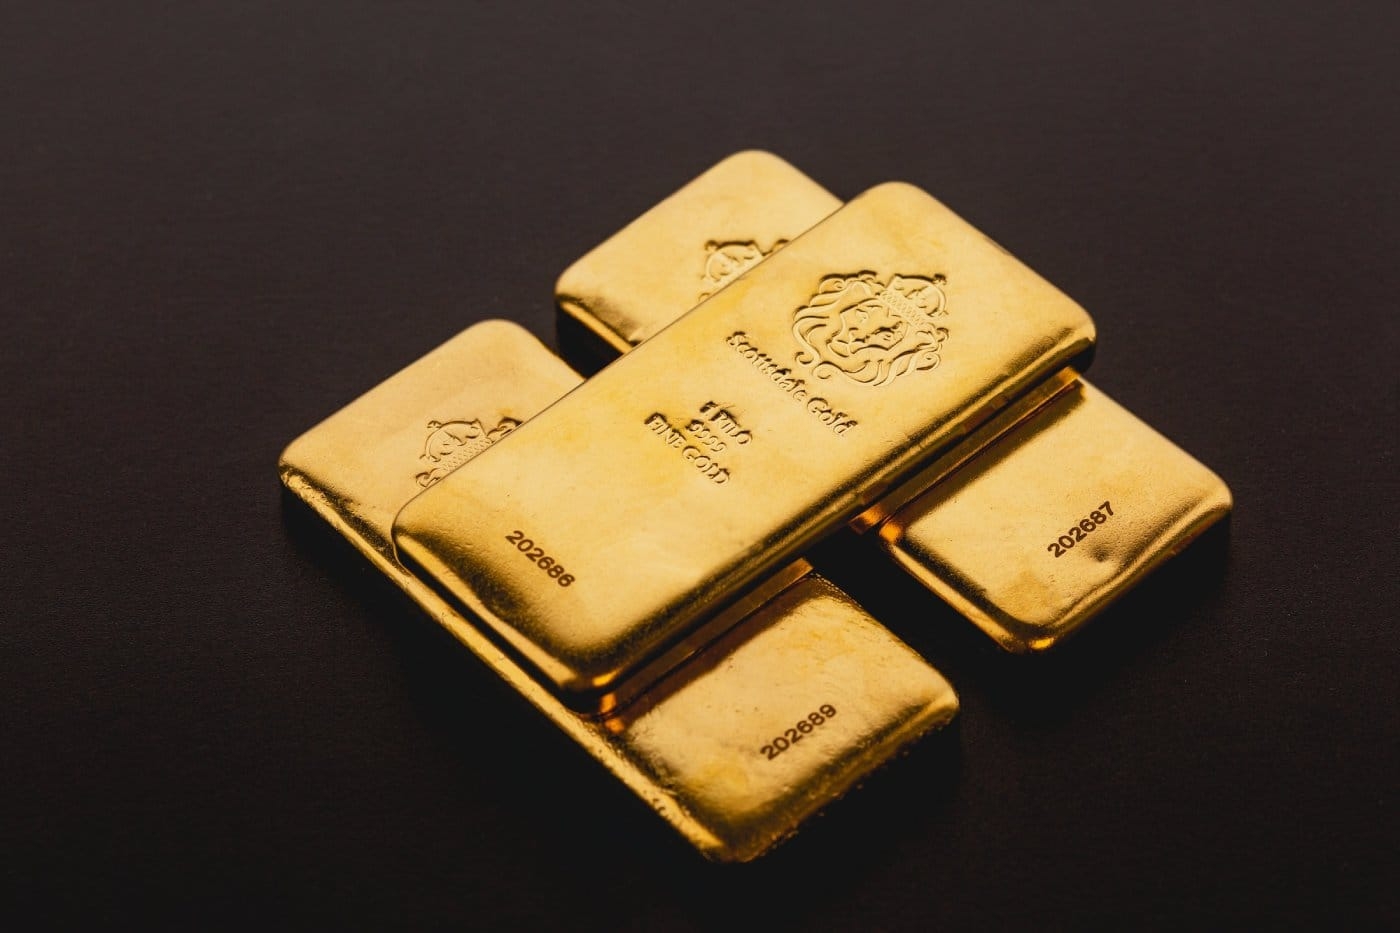
Western Australia dominates, but ASX gold mining also runs through Cambodia, Alaska and West Africa.
Gold mining companies dig ore from the ground and refine it into metal for sale. Geography varies considerably across this list: most companies here mine in Australia, but Perseus Mining ($PRU) runs all three of its producing mines in West Africa, Newmont Corp ($NEM) holds assets across five regions from Latin America to Papua New Guinea, and Emerald Resources NL ($EMR) operates its primary mine in Cambodia.
How we built this list: We selected these companies based on their industry and ordered them by market capitalisation. Prices are updated daily, and the list and supporting content are reviewed roughly every quarter. All data is sourced from Stake. This list isn't a recommendation and isn't ordered by suitability.
Company Name | Ticker | Share Price | Market Cap | In Watchlists |
|---|---|---|---|---|
Newmont Corp | $164.30 | $175.12B | 2953 | |
Northern Star Resources | $23.91 | $34.07B | 6657 | |
Evolution Mining Limited | $12.83 | $26.24B | 4553 | |
Genesis Minerals Limited | $7.07 | $8.31B | 2015 | |
Perseus Mining | $6.18 | $8.20B | 1384 | |
Capricorn Metals | $14.39 | $6.58B | 1353 | |
Ramelius Resources Limited | $3.73 | $7.03B | 2012 | |
Westgold Resources Limited | $5.20 | $4.90B | 1510 | |
Emerald Resources NL | $6.87 | $4.56B | 785 |
Past performance is not a reliable indicator of future performance.
Source: Stake market data. Figures in A$. Data updated as of 6 October 2026.
✅ Learn more: Top 10 US gold stocks to watch in 2026→
1. Newmont Corp ($NEM)

Newmont Corp (NEM) share price over the last year: started at A$133.73, ended at A$164.30, a change of +22.9%. Range over the period: high A$188.47, low A$118.18. Source: Stake market data. Past performance is not a reliable indicator of future performance.
Price: $164.30 · Daily: -0.7% · Market cap: $175.12B · Sector: Basic Materials · Industry: Metals & Mining
Gold is Newmont Corporation's ($NEM) primary product, but the company also produces copper, zinc, lead, and silver from a network of mines across five regions. Those regions are Africa, Australia, Latin America and the Caribbean, North America, and Papua New Guinea. CEO Natascha Viljoen leads a workforce of 17,500 people spread across those sites.
The operational portfolio carries twelve named mines, including Boddington, Tanami, Cadia, Lihir, Penasquito, Yanacocha, and Ahafo. Penasquito's operating concessions alone cover more than 113,000 acres, with a further 107,000 acres held for exploration.
2. Northern Star Resources ($NST)

Northern Star Resources (NST) share price over the last year: started at A$24.73, ended at A$23.91, a change of −3.3%. Range over the period: high A$31.73, low A$17.21. Source: Stake market data. Past performance is not a reliable indicator of future performance.
Price: $23.91 · Daily: 0.0% · Market cap: $34.07B · Sector: Basic Materials · Industry: Metals & Mining
Northern Star Resources ($NST) mines and processes gold in Western Australia and Alaska. The Western Australian business covers several hubs: Kalgoorlie, Carosue Dam, Jundee and Thunderbox.
The Kalgoorlie operations centre on the Kalgoorlie Consolidated Gold Mines (KCGM), which includes the Fimiston Open Pit – known as the Super Pit – the Mt Charlotte underground mine, and the Fimiston and Gidji processing plants. Thunderbox sits within the Yandal Belt and Agnew-Wiluna Belt in the Northeastern Goldfields of Western Australia. Pogo, in Alaska, rounds out the producing base. CEO Stu Tonkin leads the company.
3. Evolution Mining Limited ($EVN)

Evolution Mining Limited (EVN) share price over the last year: started at A$11.28, ended at A$12.83, a change of +13.7%. Range over the period: high A$17.67, low A$10.23. Source: Stake market data. Past performance is not a reliable indicator of future performance.
Price: $12.83 · Daily: -0.9% · Market cap: $26.24B · Sector: Basic Materials · Industry: Metals & Mining
Six mines across Australia and Canada form the production base for Evolution Mining Limited ($EVN), with CEO Lawrie Conway leading a team of 3,184 employees. The Australian sites cover New South Wales, Queensland and Western Australia; Red Lake is an underground operation in north-western Ontario. Two mines – Ernest Henry in Queensland and Northparkes in New South Wales – produce copper alongside gold. $EVN holds an 80% stake in Northparkes and full ownership of the other five.
4. Genesis Minerals Limited ($GMD)

Genesis Minerals Limited (GMD) share price over the last year: started at A$6.17, ended at A$7.07, a change of +14.6%. Range over the period: high A$8.67, low A$4.80. Source: Stake market data. Past performance is not a reliable indicator of future performance.
Price: $7.07 · Daily: 0.0% · Market cap: $8.31B · Sector: Basic Materials · Industry: Metals & Mining
Genesis Minerals Limited ($GMD) concentrates all of its gold mining activity in the Leonora District of Western Australia, running two operational hubs: Leonora Operations and Laverton Operations. The Leonora side includes the Gwalia Gold Mine, situated a few kilometres south of Leonora, alongside the Admiral, Harbour Lights, Tower Hill and Ulysses operations.
The Laverton side covers several projects including Bruno-Lewis, which sits within the northeastern goldfields of the Archaean Yilgarn Block, and the Redcliffe Project, which holds multiple deposits across the tenement. $GMD also runs its own in-house open pit mining services arm, Genesis Mining Services, rather than outsourcing that work. Under CEO Matt Nixon, the company employs 603 people.
5. Perseus Mining ($PRU)

Perseus Mining (PRU) share price over the last year: started at A$4.91, ended at A$6.18, a change of +25.9%. Range over the period: high A$6.84, low A$4.56. Source: Stake market data. Past performance is not a reliable indicator of future performance.
Price: $6.18 · Daily: -1.0% · Market cap: $8.20B · Sector: Basic Materials · Industry: Metals & Mining
Perseus Mining ($PRU) produces gold from three mines across Ghana and Côte d'Ivoire. Edikan, in Ghana's Central Region, is a large-scale multi-open-pit operation. In Côte d'Ivoire, Sissingue sits in the north near the Mali border, while Yaoure is in the country's centre, northwest of Yamoussoukro. $PRU is also developing the Nyanzaga Gold Project in Tanzania, adding a fourth country to its African operations.
6. Capricorn Metals ($CMM)

Capricorn Metals (CMM) share price over the last year: started at A$13.78, ended at A$14.39, a change of +4.4%. Range over the period: high A$17.78, low A$9.41. Source: Stake market data. Past performance is not a reliable indicator of future performance.
Price: $14.39 · Daily: 0.3% · Market cap: $6.58B · Sector: Basic Materials · Industry: Metals & Mining
Capricorn Metals ($CMM) runs its producing operations at the Karlawinda Gold Project, sitting in the Pilbara region of Western Australia roughly 65 kilometres south-east of Newman. The company wholly owns a 4,000-square-kilometre tenement package there, anchored by the Bibra gold deposit within a greenstone belt.
A second project – Mt Gibson – sits in the Murchison region of Western Australia, about 280 kilometres north-east of Perth, where $CMM is at the exploration and evaluation stage. The company has also entered a binding agreement to pick up the Mongers Lake and Claw Gold Projects, both in the same Murchison region, extending its footprint further. All of this with a team of 172 employees.
7. Ramelius Resources Limited ($RMS)

Ramelius Resources Limited (RMS) share price over the last year: started at A$4.07, ended at A$3.73, a change of −8.4%. Range over the period: high A$5.04, low A$2.82. Source: Stake market data. Past performance is not a reliable indicator of future performance.
Price: $3.73 · Daily: -2.1% · Market cap: $7.03B · Sector: Basic Materials · Industry: Metals & Mining
All of Ramelius Resources Limited's ($RMS) producing and exploration assets sit within Western Australia's Yilgarn Craton goldfields. The Mt Magnet operation lies around 500km north-east of Perth in the Murchison Goldfield; Edna May occupies the Westonia Greenstone Belt to the south. $RMS also holds a development pipeline that includes Rebecca Gold, Dalgaranga Gold, Roe Gold and the Penny Gold Mine. Mark Zeptner leads a team of 250 people across these operations.
8. Westgold Resources Limited ($WGX)

Westgold Resources Limited (WGX) share price over the last year: started at A$5.50, ended at A$5.20, a change of −5.5%. Range over the period: high A$8.05, low A$4.35. Source: Stake market data. Past performance is not a reliable indicator of future performance.
Price: $5.20 · Daily: 0.6% · Market cap: $4.90B · Sector: Basic Materials · Industry: Metals & Mining
Gold production for Westgold Resources Limited ($WGX) is concentrated entirely in Western Australia, split across two separate operational regions. The Murchison operations run three processing hubs – at Cue, Meekatharra and Fortnum – drawing ore from a cluster of historic mining centres around each town. Fortnum sits in the Bryah Basin, roughly 150km northwest of Meekatharra, while the Meekatharra hub alone encompasses several smaller historic fields including Paddy's Flat, Yaloginda and Reedy's.
The Southern Goldfields side of the business is anchored by the Beta Hunt underground mine near Kambalda, about 600km from Perth, alongside the Two Boys underground mine and smaller open-cut workings. All of that production feeds into the Higginsville processing plant, which runs at 1.6 million tonnes per annum. Wayne Bramwell leads the company, which employs 1,572 people across its sites.
9. Emerald Resources NL ($EMR)

Emerald Resources NL (EMR) share price over the last year: started at A$5.09, ended at A$6.87, a change of +35.0%. Range over the period: high A$8.00, low A$4.48. Source: Stake market data. Past performance is not a reliable indicator of future performance.
Price: $6.87 · Daily: 0.4% · Market cap: $4.56B · Sector: Basic Materials · Industry: Metals & Mining
Emerald Resources NL ($EMR) centres its production on the Okvau Gold Mine, which sits in the Mondulkiri province of eastern Cambodia, roughly 275 km north-east of Phnom Penh. That single mine is the engine of the business today, with $EMR's four segments covering mine operations, mine development, exploration and evaluation of mineral resources, and a smaller catch-all category.
Cambodia isn't the whole picture, though. The 100% owned Memot Gold Project lies about 100 km southwest of Okvau and covers approximately 107 km² that the company is working to advance. Together, $EMR's Cambodian project interests cover a combined area of over 1,428 km².
Back in Australia, $EMR holds tenements in the North Laverton Gold Project, located in the Dingo Range greenstone belt. The company employs 328 people across its operations.
➡️ Top 10 ASX mining stocks to watch in 2026→
Common questions
How do I invest in ASX gold stocks in Australia?
You can buy shares in individual ASX-listed gold miners directly through a share trading platform. All nine companies in this list trade on the ASX, so you search the relevant ticker, place an order, and settlement happens through CHESS (the ASX's central clearing and settlement system). If you'd prefer exposure across several miners at once, ASX-listed gold ETFs hold baskets of gold companies – though that's a separate product category from the individual stocks covered here.
What are the key risks of ASX gold stocks?
Gold is priced in USD, so two things can cut into revenue simultaneously: a falling gold price and a rising Australian dollar, since a stronger AUD reduces the local-currency value of each ounce sold. Operationally, miners face cost blowouts, geotechnical setbacks, permitting delays, and reserve estimate revisions. Companies with mines outside Australia – in Africa, Cambodia, or the Americas – carry sovereign and geopolitical exposure that purely domestic operations don't. Within any miner's portfolio, earlier-stage development and exploration assets carry more uncertainty than its established producing mines.
What drives the price of ASX gold stocks?
The gold spot price is the primary lever – when it rises relative to a miner's production costs, profit margins expand. Those costs are typically tracked as all-in sustaining cost (AISC) per ounce, the industry metric that captures mining, processing, royalties and sustaining capital in a single figure. The AUD/USD exchange rate then acts as a second filter, since gold is priced in USD but Australian miners report earnings in AUD. A miner's own operational performance – output volumes, ore grades and cost control – can move its share price independently of where the gold price sits.
More resources
✅ Top 7 ASX gold ETFs to watch in 2026→
Disclaimer
Past performance is not a reliable indicator of future performance. When you invest, your capital is at risk. You should consider your own investment objectives, financial situation, and particular needs before making an investment decision. The value of your investments can go down as well as up and you may receive back less than your original investment. As always, do your own research and consider seeking appropriate financial advice before investing.
This is not personal financial advice nor a recommendation to invest in the securities listed. Any advice provided by Stake is of general nature only and does not take into account your specific circumstances. Trading and volume data from the Stake investing platform is for reference purposes only, the investment choices of others may not be appropriate for your needs and is not a reliable indicator of performance.
Please refer to hellostake.com/pricing for the fees that apply. When you trade securities priced in another currency, currency conversion fees may apply and movements in the exchange rate may affect your returns.

Stake Desk
The freshest market insights
This article combines AI and human review from our analysts to bring you accurate, informative investing content at speed. For questions or suggestions, contact stakedesk@stake.com.au.
Subscribe
By subscribing, you agree to our Privacy Policy.