
Top 10 U.S. data centre stocks to watch in 2026

Data centre revenue comes from cloud providers and enterprises. Their infrastructure commitments set the pace for landlords and technology suppliers alike.
Data centres are the facilities that store, process and route data for cloud computing, AI workloads and global internet infrastructure. The ten companies in this list approach that ecosystem from three distinct sectors, with four of them structured as real estate investment trusts (REITs) that own and lease physical infrastructure rather than designing the technology running inside it. For Equinix ($EQIX) and Digital Realty Trust ($DLR) that infrastructure is data centres, while American Tower ($AMT) and Iron Mountain ($IRM) run data centres alongside their tower and records-storage businesses.
How we built this list: We selected these companies based on their industry and relevance to the theme, then ordered them by market capitalisation. Prices are updated daily, and the list and supporting content are reviewed roughly every quarter. All data is sourced from Stake. This list isn't a recommendation and isn't ordered by suitability.
Company Name | Ticker | Share Price | Market Cap | In Watchlists |
|---|---|---|---|---|
NVIDIA | $125.53 | $3.52T | 482659 | |
Microsoft | $484.52 | $3.70T | 72022 | |
Broadcom | $304.41 | $1.65T | 18332 | |
Oracle | $101.19 | $343.87B | 13414 | |
Equinix | $968.22 | $100.78B | 1881 | |
American Tower | $184.21 | $84.01B | 1262 | |
Vertiv Holdings | $166.24 | $71.23B | 6933 | |
Digital Realty | $162.46 | $65.84B | 1325 | |
Iron Mountain | $102.22 | $32.40B | 926 | |
GDS Holdings Limited | $13.33 | $2.93B | 171 |
Past performance is not a reliable indicator of future performance.
Source: Stake market data. Figures in US$. Data updated as of 20 November 2026.
✅ Learn more: Top 7 ASX data centre stocks to watch in 2026→
Sign up in minutes and get access to a CHESS-sponsored platform, where you can explore U.S. data centre stocks and more.
1. NVIDIA ($NVDA)
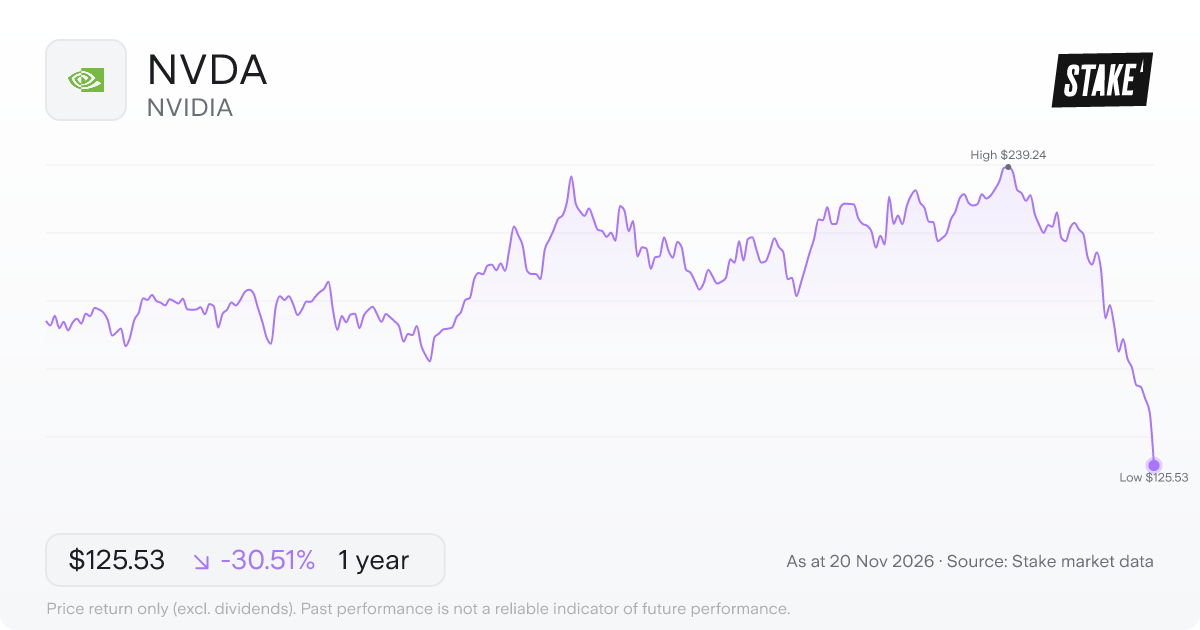
Price: US$125.53 · Daily: -14.0% · Market cap: US$3.52T · Sector: Technology · Industry: Semiconductors
NVIDIA Corporation ($NVDA) builds specialised processors and a software stack for accelerated computing – an approach that uses purpose-built hardware to tackle computationally demanding problems. Its Compute & Networking segment covers Data Center platforms, AI solutions and software, networking, and automotive technology including autonomous vehicle systems. The Graphics segment produces GeForce GPUs for gaming and Quadro/NVIDIA RTX products for professional workstations.
CUDA – $NVDA's foundational development platform – runs across all its GPUs and supports hundreds of domain-specific libraries, frameworks, software development kits (SDKs) and APIs. That environment is how developers build and deploy applications across $NVDA's four markets: Data Center, Gaming, Professional Visualisation, and Automotive.
Jensen Huang leads the company as CEO, and $NVDA employs around 42,000 people.
2. Microsoft ($MSFT)
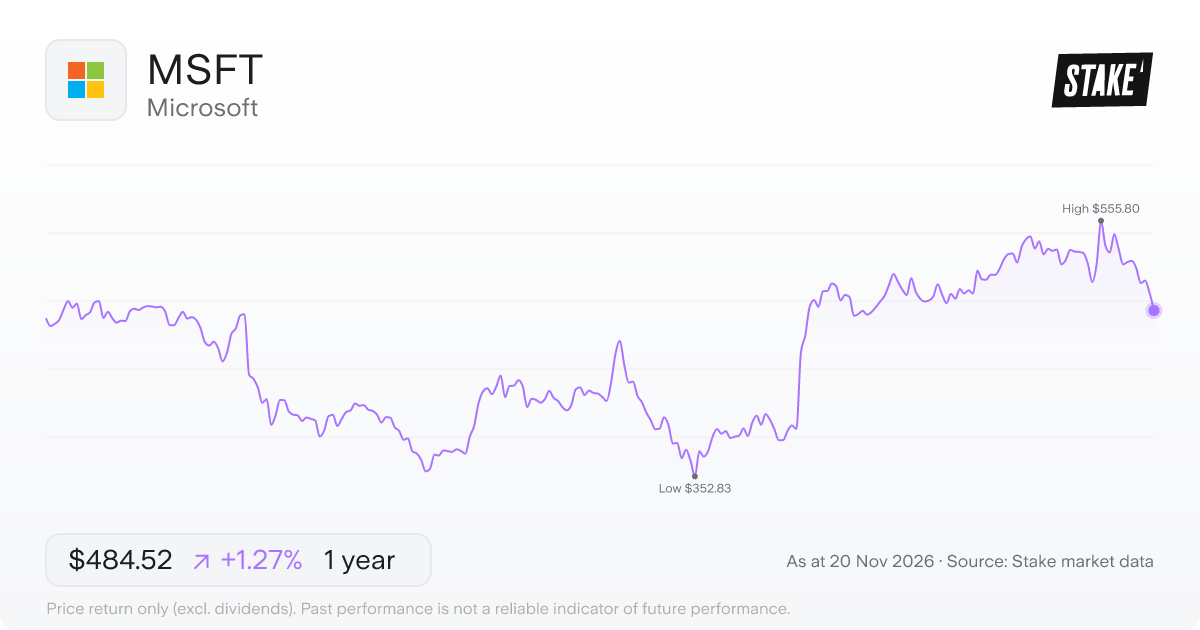
Price: US$484.52 · Daily: -2.8% · Market cap: US$3.70T · Sector: Technology · Industry: Software & IT
Satya Nadella runs Microsoft Corporation ($MSFT) across three business segments and a global workforce of 223,000. The Intelligent Cloud segment covers Azure – the company's cloud platform offering AI and other consumption-based services – alongside GitHub and Health and Life Sciences cloud services. Server products like SQL Server, Windows Server and Visual Studio also sit within that segment.
The Productivity and Business Processes segment handles Microsoft 365 for commercial and consumer customers, alongside LinkedIn and Dynamics. The More Personal Computing segment covers Windows, Xbox and search advertising.
3. Broadcom ($AVGO)
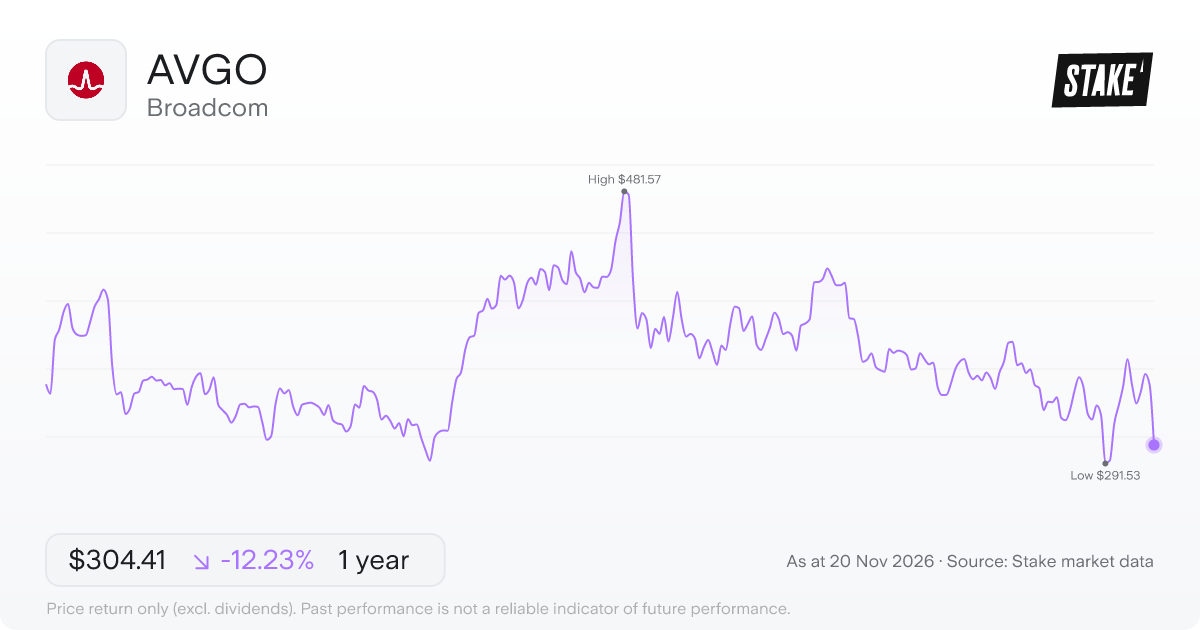
Price: US$304.41 · Daily: -12.2% · Market cap: US$1.65T · Sector: Technology · Industry: Semiconductors
Chips for AI data centres, networking equipment and wireless base stations are central to what Broadcom Inc. ($AVGO) designs and supplies. $AVGO's semiconductor portfolio also extends to set-top boxes, broadband access gear, factory automation and power generation equipment.
Alongside its chip operations, $AVGO runs an infrastructure software segment covering private cloud, mainframe software, cybersecurity and enterprise IT management tools. CEO Hock Tan leads the company's 33,000 employees.
4. Oracle ($ORCL)
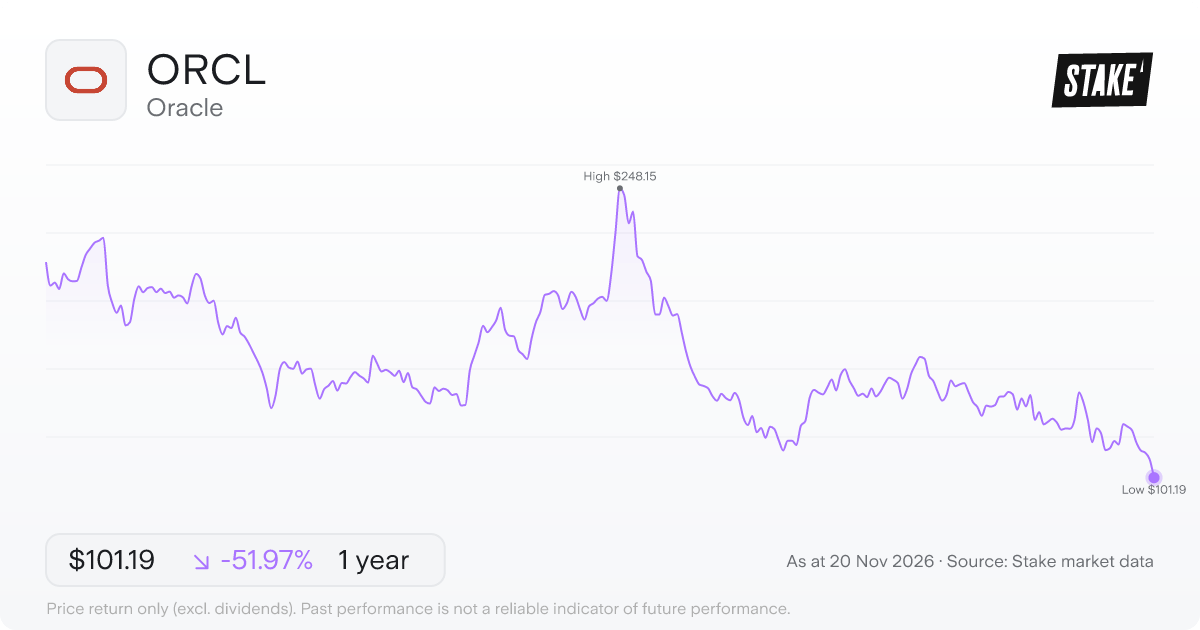
Price: US$101.19 · Daily: -8.5% · Market cap: US$343.87B · Sector: Technology · Industry: Software & IT
Oracle Corporation ($ORCL) runs its business across three segments: cloud and licence, hardware, and services. The cloud and licence arm sells enterprise applications and infrastructure technologies, both through Oracle Cloud and traditional on-premise deployments. The hardware side covers servers, storage and engineered systems, while the services segment helps organisations get more out of their existing Oracle software and infrastructure.
Clayton Magouyrk leads the company, which employs around 141,000 people globally. The Oracle Cloud is the thread connecting all three segments – the company's pitch is that its applications and infrastructure are built to work together, which shapes how it sells to enterprise customers.
5. Equinix ($EQIX)
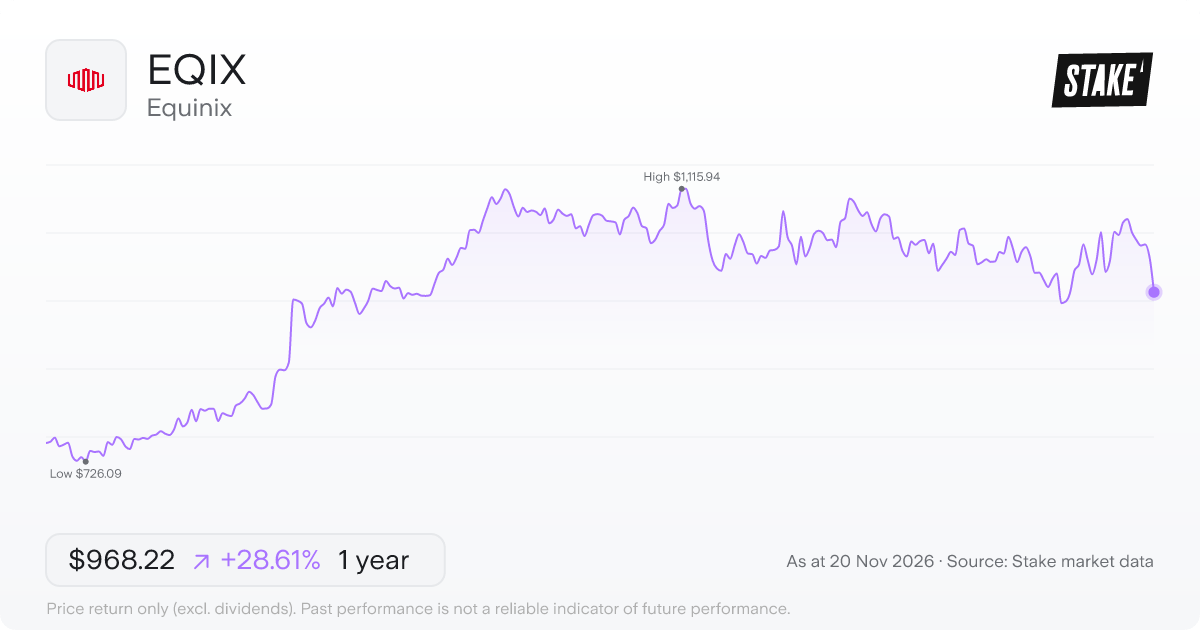
Price: US$968.22 · Daily: -4.9% · Market cap: US$100.78B · Sector: Real Estate · Industry: REITs
Equinix ($EQIX) owns and operates a global network of data centres – its International Business Exchange and xScale facilities – across the Americas, Asia-Pacific, and EMEA. The core business is colocation: companies rent space inside those buildings to house their own servers, with $EQIX supplying the power, cooling and physical security rather than the compute itself.
On top of the floor space, $EQIX offers interconnection products including Equinix Fabric and Fiber Connect, which allow customers to link directly to each other or to cloud providers without traffic having to leave the facility. CEO Adaire Fox-Martin leads a workforce of 13,716 people across that footprint.
Join 1M+ on Stake
Effortless investing in U.S. shares & ETFs
6. American Tower ($AMT)
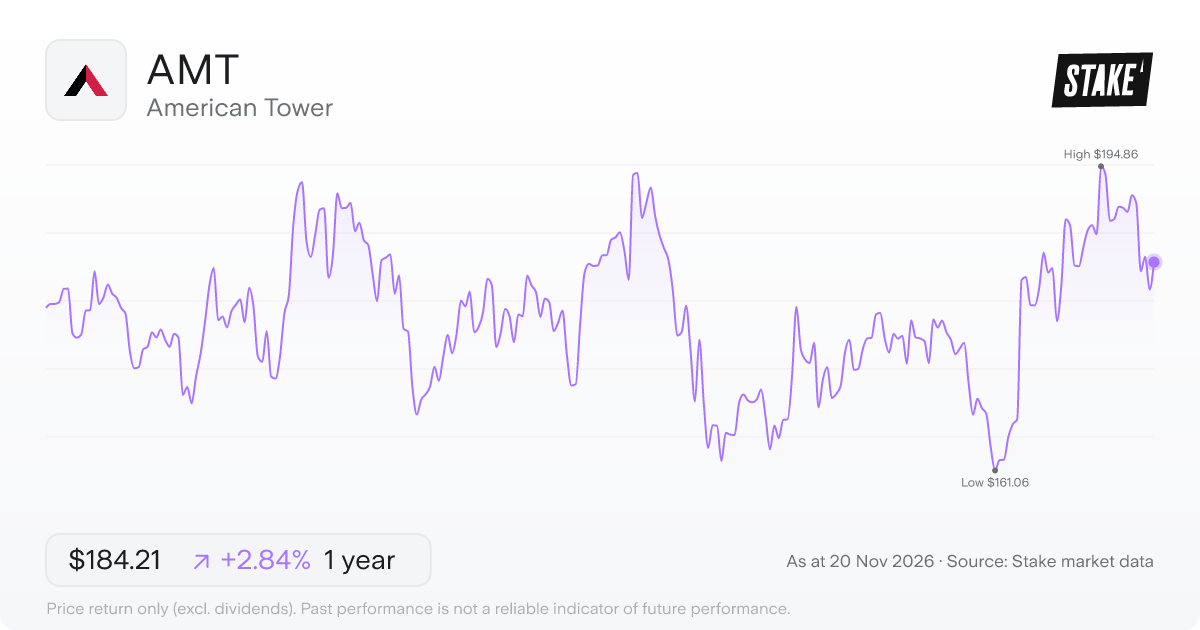
Price: US$184.21 · Daily: 1.7% · Market cap: US$84.01B · Sector: Real Estate · Industry: REITs
American Tower Corporation's ($AMT) primary business is leasing space on towers and other communications structures to wireless carriers, broadcasters, wireless data providers and government agencies. The company holds over 148,000 communications sites, with operations organised into regional property segments covering the U.S. and Canada, Latin America, Europe, and Africa and Asia-Pacific.
$AMT's Data Centers segment covers U.S.-based facilities, adding a distinct strand to the tower-heavy portfolio. Structured as a REIT, the company employs 4,866 people and is led by chief executive Steve Vondran.
7. Vertiv Holdings ($VRT)
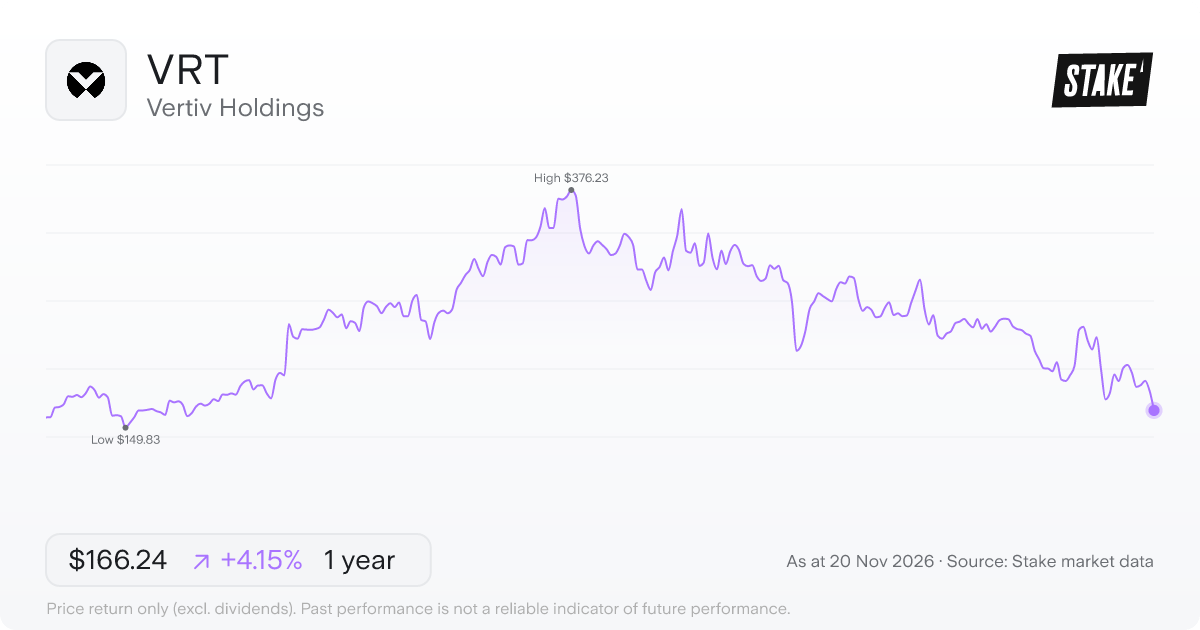
Price: US$166.24 · Daily: -10.1% · Market cap: US$71.23B · Sector: Industrials · Industry: Machinery & Vehicles
Power management and thermal control are at the core of what Vertiv Holdings Co. ($VRT) makes. Its product range covers AC and DC power systems, air-cooled and liquid-cooled thermal management, integrated rack solutions, and energy storage hardware – the physical layer that data centres, communication networks and industrial environments depend on.
$VRT also runs a services arm handling preventative maintenance, remote monitoring, engineering and consulting. With 34,000 employees and three regional segments – the Americas, Asia Pacific, and Europe, Middle East and Africa – the company is led by CEO Gio Albertazzi.
8. Digital Realty ($DLR)
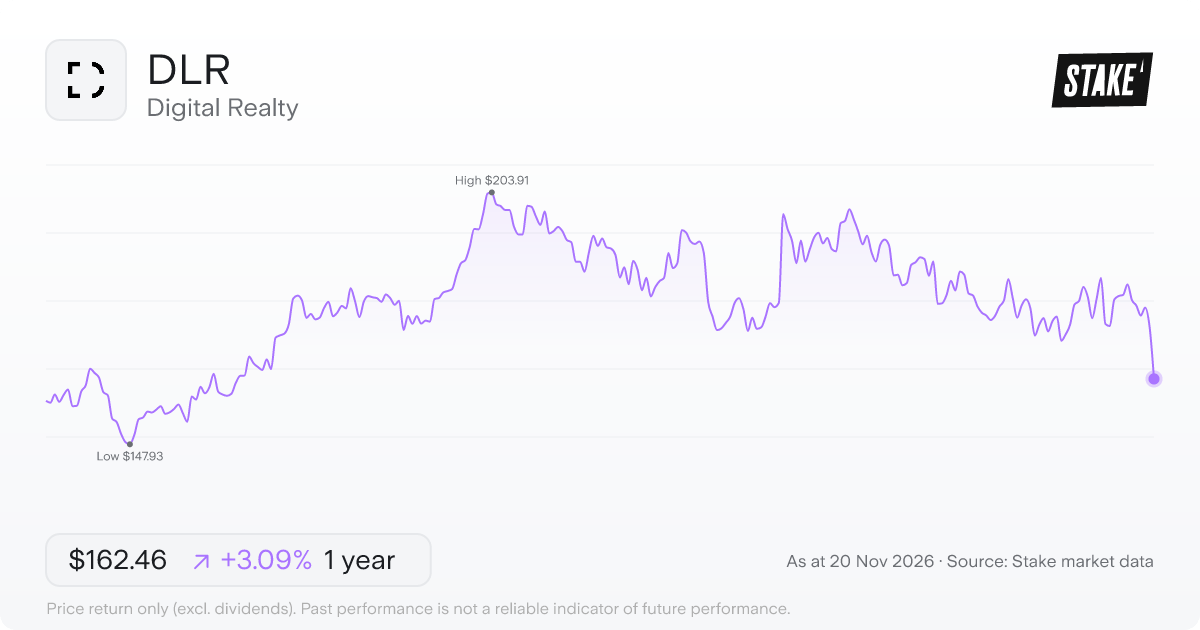
Price: US$162.46 · Daily: -6.6% · Market cap: US$65.84B · Sector: Real Estate · Industry: REITs
Digital Realty Trust ($DLR) is structured as a real estate investment trust, so its business centres on owning, developing and leasing the physical buildings that house data infrastructure. Its global footprint covers more than 300 facilities across 55+ metro areas in 30+ countries on six continents.
Customers come from industries as varied as cloud computing, financial services, healthcare and energy – all routing critical workloads through $DLR's facilities. The company's PlatformDIGITAL framework is designed to give those customers a consistent way to deploy infrastructure across that global network, with CEO Andy Power leading a workforce of 4,282 employees who manage the estate.
9. Iron Mountain ($IRM)
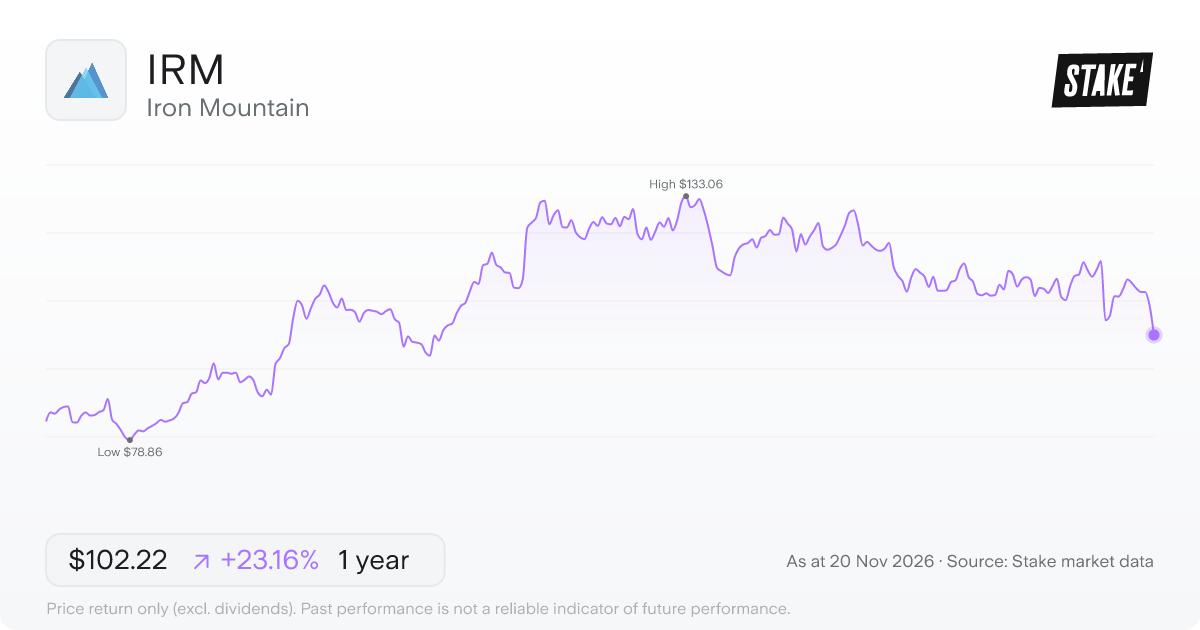
Price: US$102.22 · Daily: -6.0% · Market cap: US$32.40B · Sector: Real Estate · Industry: REITs
Iron Mountain Incorporated ($IRM) sits at an unusual intersection: it's a REIT that runs both physical records storage and data centre infrastructure under the same roof. The Global Records and Information Management segment handles the older side of the business – storing physical documents, secure shredding, media archiving and digital solutions for companies that need to manage information at scale.
The Global Data Center Business adds a second layer, providing facilities where businesses house the servers and IT infrastructure that keep their operations running. Together, the two segments mean $IRM earns from businesses whether they're digitising old files or expanding cloud capacity. CEO Bill Meaney leads a workforce of 29,400 people across both sides of that operation.
As a REIT, $IRM is required to distribute the majority of its taxable income to shareholders as dividends. That structure shapes how the company finances its growth, since it must return most of what it earns rather than retaining it all.
10. GDS Holdings Limited ($GDS)
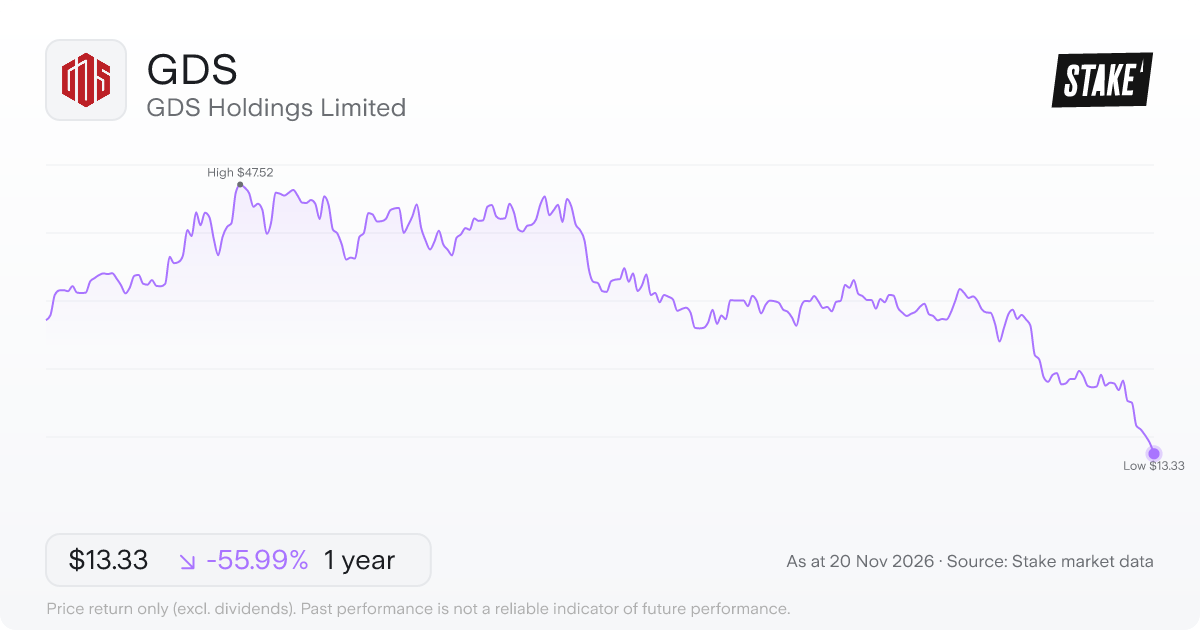
Price: US$13.33 · Daily: -9.7% · Market cap: US$2.93B · Sector: Technology · Industry: Software & IT
GDS Holdings Limited ($GDS) builds and runs high-performance data centres, handling everything from site planning and construction through to the day-to-day services that keep a customer's IT infrastructure running. Its colocation offering gives customers physical space, power capacity, racks and cooling – essentially the critical infrastructure layer underneath whatever servers or cloud workloads a tenant brings in.
Beyond colocation, $GDS offers managed hosting services that cover a broad stack: business continuity, disaster recovery, network management, data storage, system security and database services. Customers can also draw on managed cloud services and, at the advisory end, consulting. William Huang serves as CEO, and the company employs 2,434 people.
That combination of physical infrastructure and layered managed services means $GDS touches a data centre relationship at multiple levels, from the building itself to the software and operational services running inside it.
➡️ Top 9 robotics stocks to watch in 2026→
Common questions
How do I invest in U.S. data centre stocks in Australia?
Every company in this list trades on U.S. exchanges, so you'd buy them through a share trading platform that offers U.S. market access. You search by the company's ticker, place an order, and the shares settle in your account. Some ETFs listed in the U.S. or on the ASX also hold baskets of technology or data infrastructure stocks, giving exposure across several names rather than a single company.
What are the key risks of U.S. data centre stocks?
Some of the key risks include exchange rate exposure – all ten companies trade in USD, so movements between the Australian dollar and the US dollar affect what purchases cost and what any proceeds are worth in AUD. The list covers three sectors with different sensitivities: the REIT-structured names carry structural interest rate risk, since real estate investment trusts typically hold significant debt, while the Technology companies can be exposed to swings in enterprise and AI-related spending. Physical infrastructure businesses – whether they own the buildings or manufacture the equipment inside them – face capital intensity and execution risk when expanding capacity. Regulatory and geopolitical factors add a further layer, particularly for companies with substantial international operations.
How do the different types of companies in this list differ?
The list covers three distinct roles in the data centre world. Four companies are structured as real estate investment trusts (REITs), owning the physical facilities and leasing space, power and connectivity to tenants – they're closer to landlords than technology providers. Four of the Technology-sector names – $NVDA, $MSFT, $AVGO and $ORCL – build the software, cloud platforms and semiconductors that run inside those buildings, while $GDS builds and operates data centres itself. $VRT is different again: it makes the power management and thermal control equipment that data centres depend on to keep hardware running, sitting between the property owners and the technology stack rather than belonging neatly to either group.
More resources
✅ Top 10 AI stocks to watch in 2026→
Disclaimer
Past performance is not a reliable indicator of future performance. When you invest, your capital is at risk. You should consider your own investment objectives, financial situation, and particular needs before making an investment decision. The value of your investments can go down as well as up and you may receive back less than your original investment. As always, do your own research and consider seeking appropriate financial advice before investing.
This is not personal financial advice nor a recommendation to invest in the securities listed. Any advice provided by Stake is of general nature only and does not take into account your specific circumstances. Trading and volume data from the Stake investing platform is for reference purposes only, the investment choices of others may not be appropriate for your needs and is not a reliable indicator of performance.
Please refer to hellostake.com/pricing for the fees that apply. When you trade securities priced in another currency, currency conversion fees may apply and movements in the exchange rate may affect your returns.

Stake Desk
The freshest market insights
This article combines AI and human review from our analysts to bring you accurate, informative investing content at speed. For questions or suggestions, contact stakedesk@stake.com.au.
Subscribe
By subscribing, you agree to our Privacy Policy.


