
Top 12 nuclear energy stocks to watch in 2026
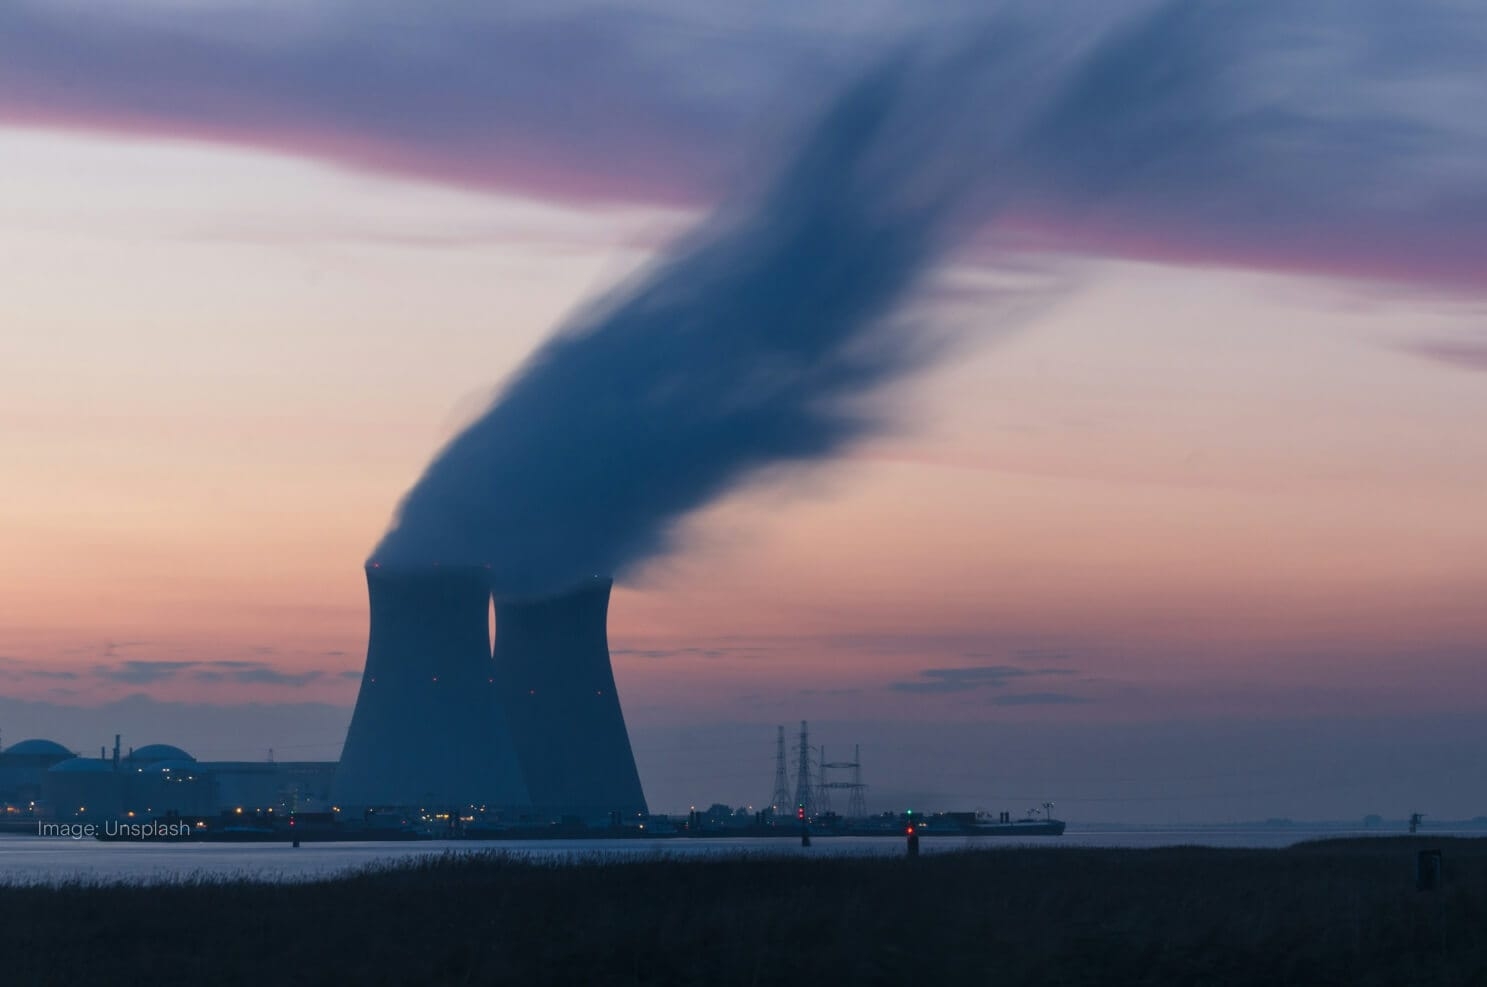
Uranium can't become reactor fuel without regulatory clearance at each step. That puts government decisions at the centre of most business models across the chain.
Nuclear energy covers the full chain from mining uranium to delivering electricity into the grid. This list of 12 spans that entire chain – uranium producers like Cameco ($CCJ), specialist reactor manufacturers like BWX Technologies ($BWXT), and utilities such as Constellation Energy ($CEG) that generate and sell the power.
How we built this list: We selected these companies based on their industry and ordered them by market capitalisation. Prices are updated daily, and the list and supporting content are reviewed roughly every quarter. All data is sourced from Stake. This list isn't a recommendation and isn't ordered by suitability.
Company Name | Ticker | Share Price | Market Cap | In Watchlists |
|---|---|---|---|---|
GE Vernova | $1,029.21 | $263.67B | 3247 | |
NextEra Energy | $77.88 | $159.12B | 4923 | |
Constellation Energy | $300.40 | $94.82B | 4604 | |
Dominion Energy | $62.00 | $53.67B | 464 | |
Cameco | $93.02 | $54.36B | 4341 | |
BWX Technologies | $145.70 | $12.40B | 1398 | |
Brookfield Renewable Partners | $29.42 | $12.08B | 2019 | |
Uranium Energy | $10.11 | $4.63B | 3447 | |
Energy Fuels | $11.26 | $4.07B | 2731 | |
NuScale Power | $8.02 | $3.30B | 4321 | |
Centrus Energy | $153.88 | $2.89B | 1921 | |
Nano Nuclear | $16.49 | $832.9M | 1529 |
Past performance is not a reliable indicator of future performance.
Source: Stake market data. Figures in US$. Data updated as of 6 October 2026.
✅ Learn more: Top 10 ASX energy stocks to watch in 2026→
1. GE Vernova ($GEV)

GE Vernova (GEV) share price over the last year: started at US$603.22, ended at US$1,029.21, a change of +70.6%. Range over the period: high US$1,174.86, low US$547.96. Source: Stake market data. Past performance is not a reliable indicator of future performance.
Price: US$1,029.21 · Daily: 4.0% · Market cap: US$263.67B · Sector: Utilities · Industry: Electric & IPPs
GE Vernova Inc. ($GEV) is in the business of building and servicing power infrastructure, covering everything from the turbines inside a plant to the grid hardware that carries electricity to homes and businesses. Its Power segment includes nuclear alongside gas, hydro and steam generation. The Wind segment handles onshore and offshore turbines and blades. The Electrification segment manages what comes after generation: transmission hardware, power conversion, storage and the software that moves electricity from plant to end user.
$GEV employs 75,000 people under CEO Scott Strazik. An accelerator business adds advanced research, consulting and financial services alongside the manufacturing core.
2. NextEra Energy ($NEE)

NextEra Energy (NEE) share price over the last year: started at US$82.11, ended at US$77.88, a change of −5.2%. Range over the period: high US$97.88, low US$75.49. Source: Stake market data. Past performance is not a reliable indicator of future performance.
Price: US$77.88 · Daily: 2.1% · Market cap: US$159.12B · Sector: Utilities · Industry: Electric & IPPs
NextEra Energy ($NEE) runs two distinct businesses under a single parent. Florida Power & Light Company (FPL) is a rate-regulated electric utility that generates, transmits and sells electricity across Florida. It draws on roughly 35,052 megawatts of net generating capacity and operates more than 91,000 circuit miles of transmission and distribution lines across 921 substations.
The other segment, NextEra Energy Resources (NEER), operates in wholesale electricity markets across the U.S. and Canada. NEER develops, constructs and manages electric generation facilities, and holds assets in battery storage, natural gas pipelines and renewable fuels. It also develops rate-regulated transmission infrastructure in North America. Across both segments, $NEE employs 17,400 people under CEO John Ketchum.
3. Constellation Energy ($CEG)

Constellation Energy (CEG) share price over the last year: started at US$364.10, ended at US$300.40, a change of −17.5%. Range over the period: high US$403.95, low US$236.50. Source: Stake market data. Past performance is not a reliable indicator of future performance.
Price: US$300.40 · Daily: 12.2% · Market cap: US$94.82B · Sector: Utilities · Industry: Electric & IPPs
Constellation Energy ($CEG) sits at the delivery end of the nuclear chain – it generates and sells electricity rather than mining fuel or building reactors. Nuclear makes up the core of its generation fleet, alongside hydro, wind and solar, with the company saying its facilities have enough capacity to power the equivalent of 27 million homes.
Its customers include distribution utilities, municipalities, commercial businesses and residential users across multiple U.S. regions. Chief executive Joe Dominguez leads a workforce of 15,291 people, and the company operates approximately 55 gigawatts of total generation capacity.
4. Dominion Energy ($D)

Dominion Energy (D) share price over the last year: started at US$61.50, ended at US$62.00, a change of +0.8%. Range over the period: high US$71.69, low US$57.08. Source: Stake market data. Past performance is not a reliable indicator of future performance.
Price: US$62.00 · Daily: 1.6% · Market cap: US$53.67B · Sector: Utilities · Industry: Electric & IPPs
Dominion Energy ($D) runs regulated electricity networks across Virginia, North Carolina and South Carolina, reaching around 3.6 million homes and businesses. It also distributes natural gas to over 500,000 customers in South Carolina, with that side of the business sitting under its South Carolina segment.
Beyond the traditional grid, $D develops and operates regulated offshore wind and solar projects, and produces carbon-free electricity in New England through its contracted energy operations. Robert Blue leads a workforce of 15,200 people across all of these segments.
5. Cameco ($CCJ)

Cameco (CCJ) share price over the last year: started at US$85.31, ended at US$93.02, a change of +9.0%. Range over the period: high US$134.09, low US$79.44. Source: Stake market data. Past performance is not a reliable indicator of future performance.
Price: US$93.02 · Daily: 6.3% · Market cap: US$54.36B · Sector: Energy · Industry: Uranium
Cameco Corporation ($CCJ) covers more of the nuclear fuel chain than most names in this list. Its uranium segment mines and mills uranium concentrate at two operating mines – Cigar Lake and McArthur River – while a separate fuel services segment handles refining, conversion and fabrication of that concentrate into usable reactor fuel.
The third piece is Westinghouse, a nuclear reactor technology manufacturer that $CCJ holds as an equity-accounted investment. Westinghouse sells products and services to commercial utilities and government agencies across the globe, covering everything from reactor components to outage and maintenance work. Tim Gitzel serves as CEO.
6. BWX Technologies ($BWXT)

BWX Technologies (BWXT) share price over the last year: started at US$191.38, ended at US$145.70, a change of −23.9%. Range over the period: high US$238.42, low US$134.35. Source: Stake market data. Past performance is not a reliable indicator of future performance.
Price: US$145.70 · Daily: 7.6% · Market cap: US$12.40B · Sector: Industrials · Industry: Aerospace & Defence
Naval nuclear reactors are at the core of what BWX Technologies ($BWXT) does. Its Government Operations segment manufactures reactors and nuclear fuel for the U.S. Naval Nuclear Propulsion Program, covering the power plants inside submarines and aircraft carriers. On the civilian side, $BWXT's Commercial Operations segment designs and manufactures steam generators, pressure vessels, heat exchangers and other components for commercial nuclear plants. The company employs around 10,400 people across both divisions.
7. Brookfield Renewable Partners ($BEP)

Brookfield Renewable Partners (BEP) share price over the last year: started at US$27.40, ended at US$29.42, a change of +7.4%. Range over the period: high US$37.31, low US$26.29. Source: Stake market data. Past performance is not a reliable indicator of future performance.
Price: US$29.42 · Daily: 4.3% · Market cap: US$12.08B · Sector: Utilities · Industry: Electric & IPPs
Brookfield Renewable Partners ($BEP) runs a renewable power platform of roughly 46,200 megawatts of installed capacity across hydroelectric, wind, utility-scale solar, distributed generation and storage facilities in North America, South America, Europe and Asia-Pacific. Nuclear services sit inside $BEP's sustainable solutions segment, alongside carbon capture, biomass and battery storage – so its nuclear exposure is one piece of a much wider decarbonisation business rather than a dedicated nuclear operation.
The development pipeline adds another dimension: the company says it has approximately 200,000 megawatts of projects in various stages of development, spread across those same geographies. CEO Connor Teskey leads a workforce of 5,870 people across those operations.
8. Uranium Energy ($UEC)

Uranium Energy (UEC) share price over the last year: started at US$13.05, ended at US$10.11, a change of −22.5%. Range over the period: high US$20.14, low US$9.04. Source: Stake market data. Past performance is not a reliable indicator of future performance.
Price: US$10.11 · Daily: 8.1% · Market cap: US$4.63B · Sector: Energy · Industry: Uranium
Uranium Energy Corp ($UEC) extracts uranium using in-situ recovery (ISR), a method that circulates solution through underground ore to dissolve and recover uranium without conventional excavation. The company holds two extraction-ready ISR hub-and-spoke platforms – one in South Texas anchored by the Hobson processing plant, and one in Wyoming centred on the Irigaray plant.
Its project portfolio covers Wyoming, Texas and Saskatchewan, Canada, taking in operational mines at Palangana and Christensen Ranch alongside development assets including Roughrider and Christie Lake. Through its wholly owned subsidiary United States Uranium Refining & Conversion Corp, Uranium Energy Corp ($UEC) is also building domestic refining and conversion capabilities.
9. Energy Fuels ($UUUU)

Energy Fuels (UUUU) share price over the last year: started at US$16.91, ended at US$11.26, a change of −33.4%. Range over the period: high US$27.72, low US$10.71. Source: Stake market data. Past performance is not a reliable indicator of future performance.
Price: US$11.26 · Daily: 4.1% · Market cap: US$4.07B · Sector: Energy · Industry: Uranium
Energy Fuels Inc. ($UUUU) runs three business segments: uranium, rare earth elements (REEs), and heavy mineral sands (HMS). Its uranium operations combine conventional mining with in-situ recovery (ISR) extraction and also recycle uranium-bearing materials sourced from third parties.
The REE side covers 17 materials used in electric vehicles, wind turbines, robotics and defence applications, among others. $UUUU's HMS operations recover titanium, zirconium and rare earth minerals from old beach and dune sands, with projects including Vara Mada, Donald, Bahia and Kwale.
10. NuScale Power ($SMR)

NuScale Power (SMR) share price over the last year: started at US$41.94, ended at US$8.02, a change of −80.9%. Range over the period: high US$53.43, low US$7.59. Source: Stake market data. Past performance is not a reliable indicator of future performance.
Price: US$8.02 · Daily: 4.4% · Market cap: US$3.30B · Sector: Utilities · Industry: Electric & IPPs
NuScale Power ($SMR) develops a proprietary small pressurised water reactor called the NuScale Power Module, which generates around 77 megawatts of electricity per unit. The design is modular – customers can configure anywhere from one unit up to 12 in parallel, reaching up to 924 megawatts of combined output.
Beyond the reactor hardware itself, $SMR provides services across a plant's full life cycle, from licensing support and testing through to fuel supply and program management. Its customers include domestic and international governments, utilities, state-owned enterprises and technology and industrial companies seeking carbon-free power.
11. Centrus Energy ($LEU)

Centrus Energy (LEU) share price over the last year: started at US$356.28, ended at US$153.88, a change of −56.8%. Range over the period: high US$436.00, low US$138.18. Source: Stake market data. Past performance is not a reliable indicator of future performance.
Price: US$153.88 · Daily: 8.8% · Market cap: US$2.89B · Sector: Energy · Industry: Uranium
Centrus Energy ($LEU) sits in the fuel supply chain rather than the mining or generation side of nuclear power. The company sources and sells low-enriched uranium – the fissile material that goes into the fuel rods utilities load into commercial reactors. Its customers are mainly power plant operators who need a reliable supply of that material to keep their plants running.
The second part of the business is more specialised. Through its Technical Solutions segment, $LEU produces high-assay low-enriched uranium, known as HALEU, which is the fuel type required for many next-generation reactor designs. That work serves both the U.S. government and private customers developing advanced nuclear technologies. With around 300 employees, Centrus is a compact operation, but its role in domestic HALEU production puts it in a part of the supply chain that few other companies currently occupy.
CEO Amir Vexler oversees both the commercial fuel supply business and the government-facing technical work, which gives the company exposure to two distinct customer bases within the same industry.
12. Nano Nuclear ($NNE)

Nano Nuclear (NNE) share price over the last year: started at US$53.63, ended at US$16.49, a change of −69.3%. Range over the period: high US$56.63, low US$14.88. Source: Stake market data. Past performance is not a reliable indicator of future performance.
Price: US$16.49 · Daily: 6.3% · Market cap: US$832.9M · Sector: Utilities · Industry: Electric & IPPs
Nano Nuclear Energy ($NNE) is building out what it describes as a vertically integrated nuclear energy business – covering reactor design, fuel production, fuel transport, and consulting services, all under one roof. Its flagship product is the KRONOS MMR Energy System, a microreactor the company is developing for both small- and large-scale power generation.
The fuel side of the business is equally central. Through subsidiaries HALEU Energy Fuel Inc. and American Uranium Inc., $NNE is working to establish a domestic supply chain for low-enriched uranium (LEU) and high-assay low-enriched uranium (HALEU) – the fuels that next-generation reactors require. Advanced Fuel Transportation Inc. rounds out that picture by handling the logistics end of moving nuclear fuel.
With just 36 employees under CEO James Walker, $NNE is still firmly in the development phase. Its broad subsidiary structure – including Nano Nuclear Space Inc. and True North Nuclear Ltd. – signals ambitions well beyond a single reactor design, though all of these ventures remain at early stages.
➡️ Top 7 ASX renewable energy stocks to watch in 2026→
Common questions
How can Australian investors buy nuclear energy stocks?
All 12 stocks in this list trade on U.S. exchanges, so you'd need a share trading platform that provides U.S. market access. Each company is searchable by its ticker. Because these stocks are priced in USD, movements in the AUD/USD exchange rate affect the value of holdings when converted back to Australian dollars.
What are the key risks of nuclear energy stocks?
The risks shift depending on where a company operates. Uranium producers face commodity price swings driven by mine supply, enrichment capacity and government purchasing decisions. Reactor developers carry licensing, construction and commercialisation risk – nuclear regulatory approval processes are lengthy and outcomes are uncertain. Utilities face energy market regulation and the economics of plant licence renewals, and all 12 companies carry AUD/USD exposure given they trade in U.S. dollars.
How do the types of companies in this list differ?
The 12 stocks cover three distinct parts of the nuclear energy landscape. Some are in the fuel supply chain – mining or processing uranium, converting it, or enriching it into reactor-grade fuel. Others are technology and engineering businesses that design reactor systems, manufacture nuclear components or service existing plant. The third group are utilities and power generators that own operating capacity and sell electricity to the grid, treating nuclear as one generation source among several.
What are small modular reactors?
Small modular reactors (SMRs) are nuclear reactor designs built around a smaller, more standardised format than conventional large-scale power plants, with the aim of using factory-manufactured components to reduce construction complexity. NuScale Power ($SMR) has a pressurised water reactor design capable of generating around 77 megawatts per module, scalable up to 924 megawatts across 12 modules. Nano Nuclear Energy ($NNE) is developing microreactor technology through its KRONOS MMR system, alongside a domestic fuel supply chain. Both companies are at early commercial stages, carrying more development and regulatory uncertainty than the established operators and uranium producers in this list.
More resources
✅ Top 5 nuclear energy ETFs to watch in 2026→
Disclaimer
Past performance is not a reliable indicator of future performance. When you invest, your capital is at risk. You should consider your own investment objectives, financial situation, and particular needs before making an investment decision. The value of your investments can go down as well as up and you may receive back less than your original investment. As always, do your own research and consider seeking appropriate financial advice before investing.
This is not personal financial advice nor a recommendation to invest in the securities listed. Any advice provided by Stake is of general nature only and does not take into account your specific circumstances. Trading and volume data from the Stake investing platform is for reference purposes only, the investment choices of others may not be appropriate for your needs and is not a reliable indicator of performance.
Please refer to hellostake.com/pricing for the fees that apply. When you trade securities priced in another currency, currency conversion fees may apply and movements in the exchange rate may affect your returns.

Stake Desk
The freshest market insights
This article combines AI and human review from our analysts to bring you accurate, informative investing content at speed. For questions or suggestions, contact stakedesk@stake.com.au.
Subscribe
By subscribing, you agree to our Privacy Policy.